![]()
![]()
![]()
![]()
![]()
![]()
![]()
|
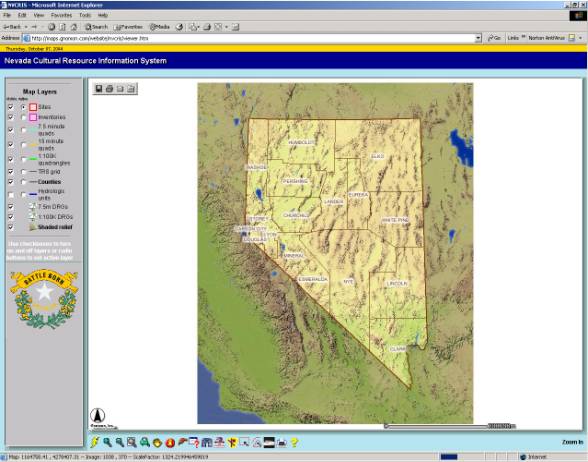
In Lesson Two, we will learn simple methods to construct a Query statement that will refine your data search.
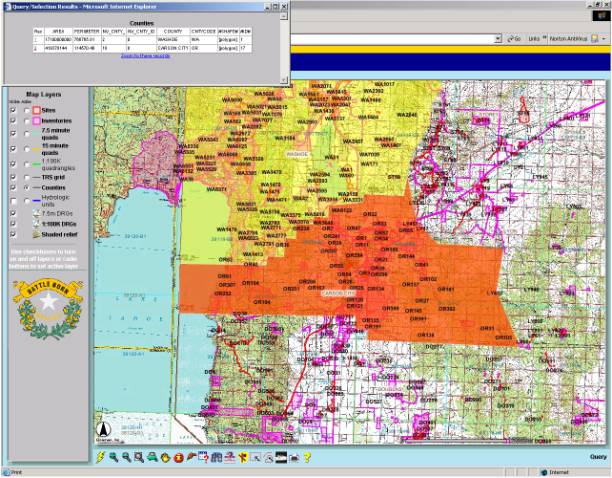
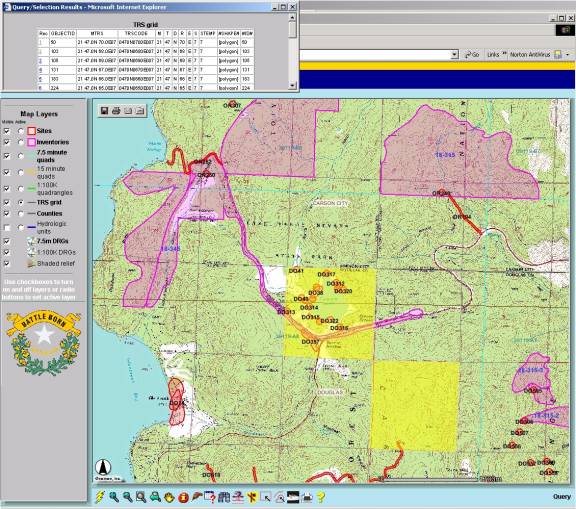
A query box appears at the bottom of the map.
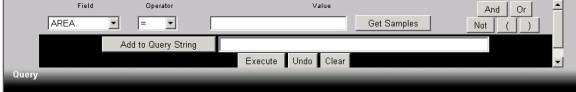
Use the pulldown menus to enter the query data. All fields within the active layer may be queried against the field attributes for that data set.
 box, select County.
 Alternatively, type "CARSON CITY" in the value box.
Note: Fields are case sensitive, and since they are data strings, must be enclosed by " "s.
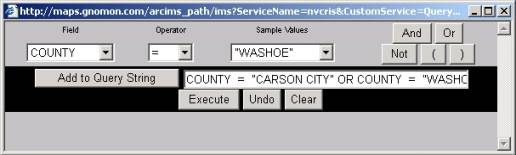
Multiple queries can be constructed by repeating the process. Using the same process, we will include Washoe County in the query string.
§
Click the ![]() button, then
button, then
§ Using the same process, add COUNTY="WASHOE" to the query string.
§
Click ![]() .
.
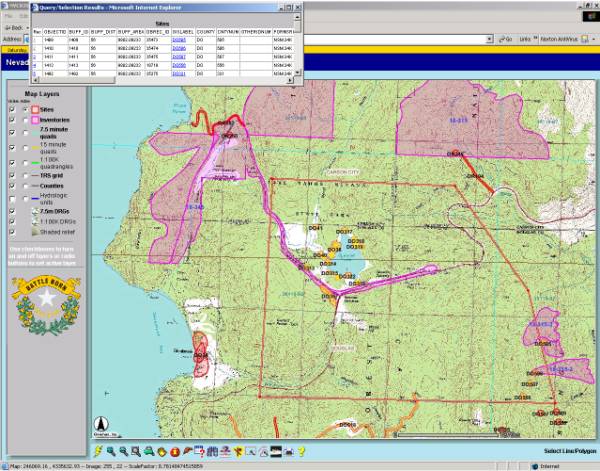
The query results are displayed graphically and in tabular form.
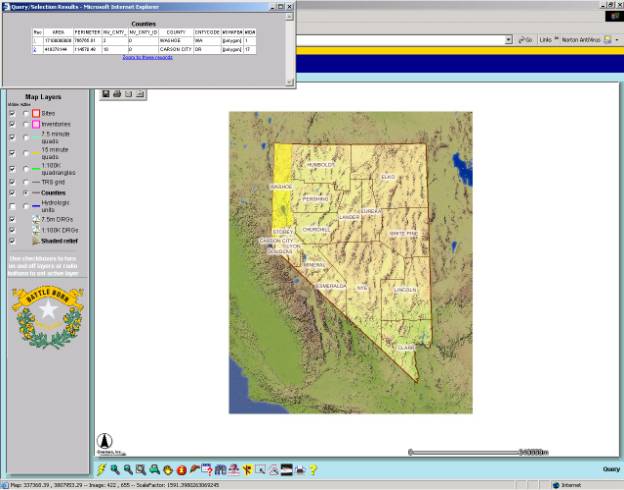
§ Select 2 to zoom to Carson City
Carson City is selected and is placed in the center of the display.
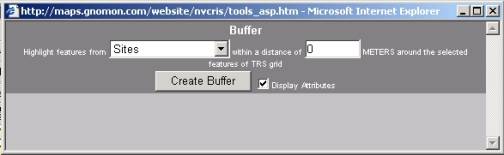
In order to buffer a feature, an area must first be selected so that a buffer can be applied.
The TRS grid should show on the map.
§
Select the Clear Selection Button ![]() to remove
the shaded county background.
to remove
the shaded county background.
§ Confirm OK.
§
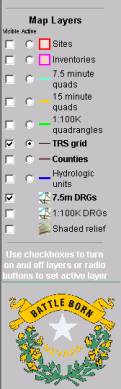
Make the TRS grid Map Layer active ![]()
.
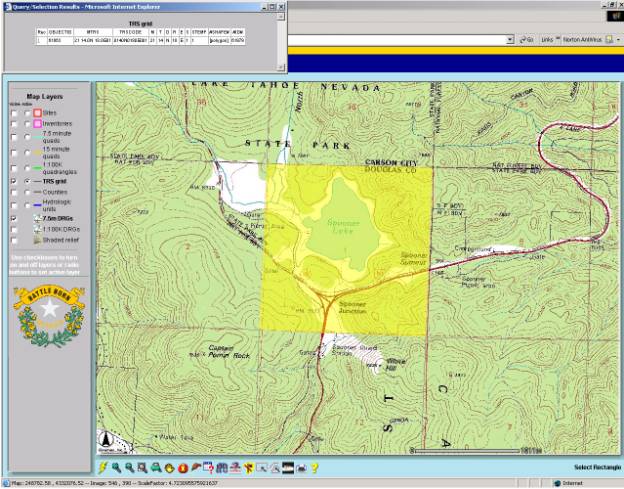
§ Zoom to Section 1 (Spooner Lake)
§
From the Button Bar, Click the Select by Rectangle
Button ![]() , left
click and drag the cursor to create a small box around the number 1 in Section
1.
, left
click and drag the cursor to create a small box around the number 1 in Section
1.
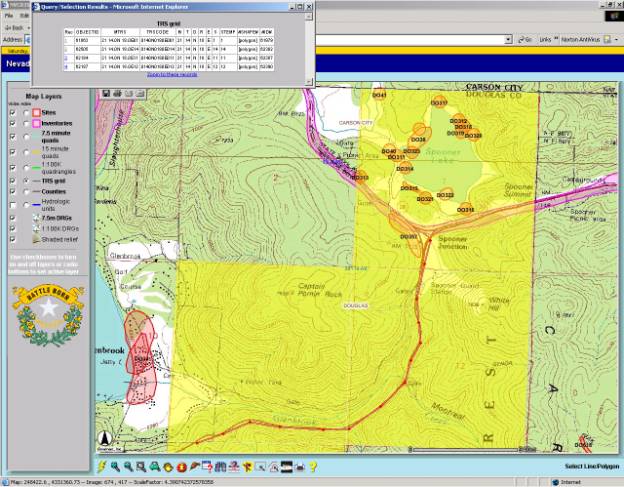
Section 1 is selected. Note how the TRSCODE is encoded. 0140N01180E001 = T.14.0N. R.18.0E, Section 01.
§ Make the Sites and Inventories visible.
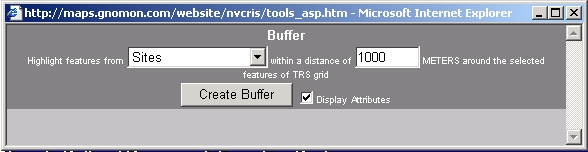
The Buffer box is displayed.

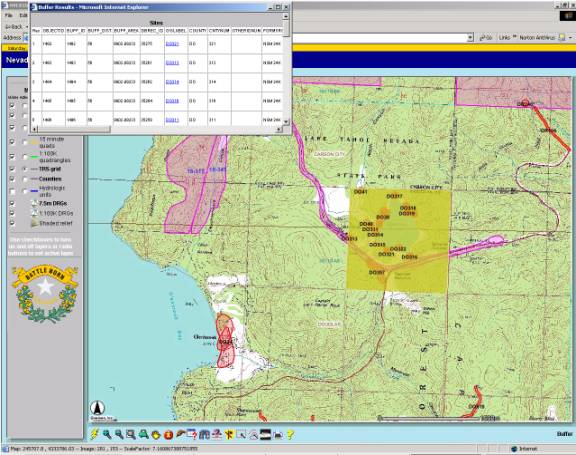
§ The results are displayed and all Inventories intersecting the buffered area are displayed.
§
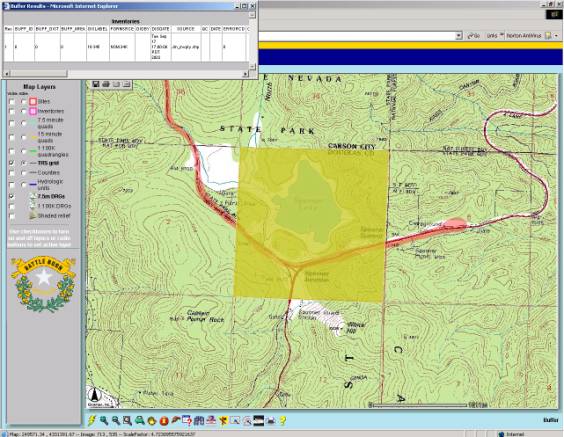
§ Scroll down the Attribute table to view tabular results.
§ Perform a similar search for sites within Section 1.
All sites within 1000 meters of Section 1 are displayed.
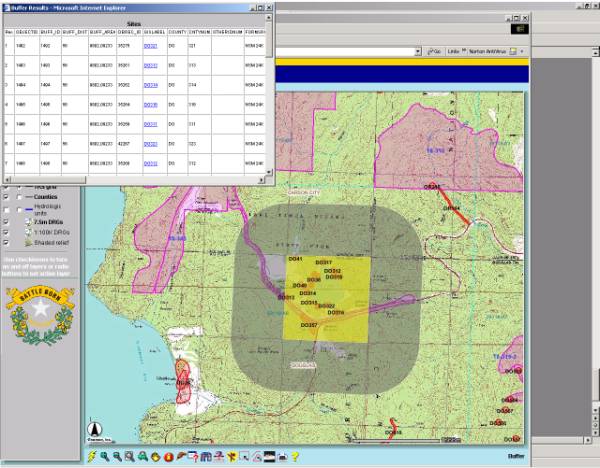
Scroll through sites and click on underlined and highlighted site numbers (DO314) to view scanned site record.
§ Make sure TRS Grid is active.
§
Select the Query ![]() button and
create a selection for T.14N. R.18E Section 1.
button and
create a selection for T.14N. R.18E Section 1.
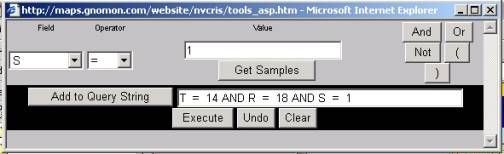
Section 1 is selected.
§ Buffer the TRS layer to identify sites within 0 meters selected sections.
Only sites within Section 1 are displayed.
It is sometimes easier to make a TRS section for an extensive project area by drawing an approximate project boundary.
Clear the previous selection.
§
Select the Clear Selection Button ![]() and confirm selection cleared.
and confirm selection cleared.
§ Make sure the TRS Map Layer is active.
§ Using the Zoom In tool, left click and drag to from the upper left corner of Section 2 to the lower right corner of Section 12.
§
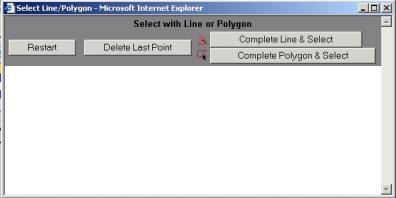
Left click on the Select Line/Polygon Button ![]() .
.
§ Place the cursor at the US 50 and SR28 intersection (Spooner Junction).
§ Left click to place a point.
§ Continue placing points along US 50 to approximate a project area from Spooner Junction to Glenbrook.
§ Double Left click to end the line.
§
Left click on the Select Line/Polygon Button ![]() .
.
From the pop-up screen,

§ Click Complete Line & Select box
All Sections intersected by the line segments are drawn.
Queries and selections can be refined to specific data requirements.
Clear the previous selection. Select the Clear Selection
Button ![]() and confirm selection cleared.
and confirm selection cleared.
§ Make sure the Sites Map Layer is active.
§ Select the Zoom Out Button
§ Place the cursor on Spooner Lake and left click
§
Left click on the Select Line/Polygon Button ![]() .
.
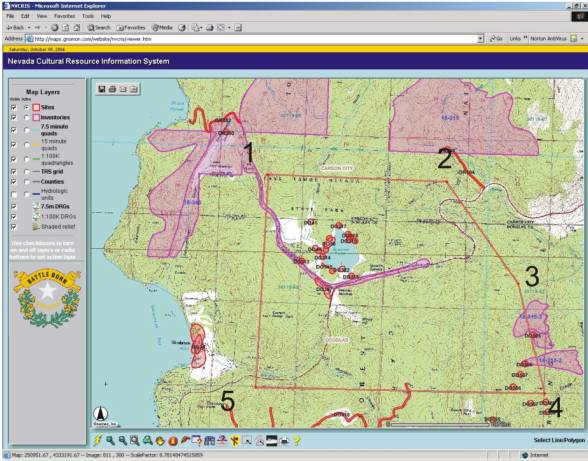
Using the same process for drawing a line, place points that approximate the shape below to draw a project polygon.
§ Double left click at point 5.
§
Left click on the Select Line/Polygon Button ![]() .
.
From the pop-up screen,
§
This automatically closes the polygon by creating a line between the last and first point, then creates a selection of all sites within the polygon.
Printing Query Results
Upon completion of a Web query, you may wish to print the results. Data returned in table format can be selected, copied, and then pasted into Excel or a similar spreadsheet. The Print Button provides a printed version of the map.
From the existing display,
§ Place the cursor in the Sites table.
§ Right click the mouse.
A pull down box appears.
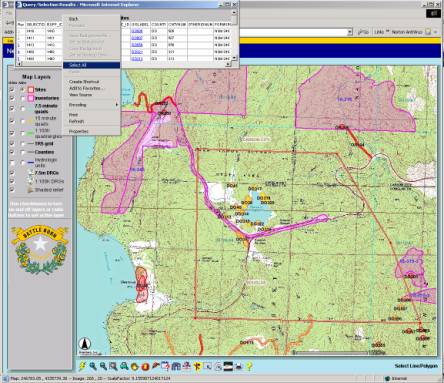
§ Left click Select All
All records are selected
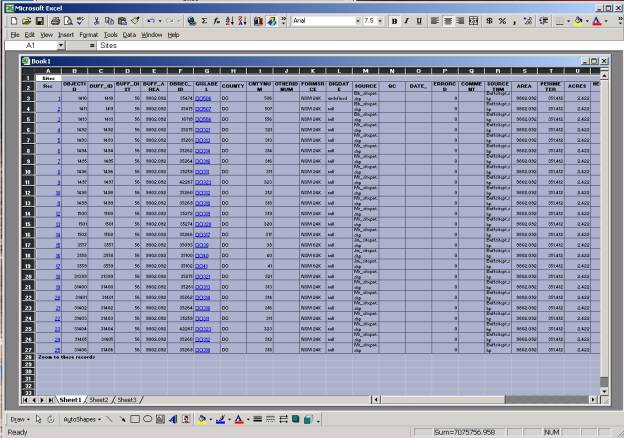
Press Ctrl C to copy the selection
Open Excel or a suitable spreadsheet.
Using the spreadsheets paste feature, paste the selected records.
§
Select the Print Button ![]()
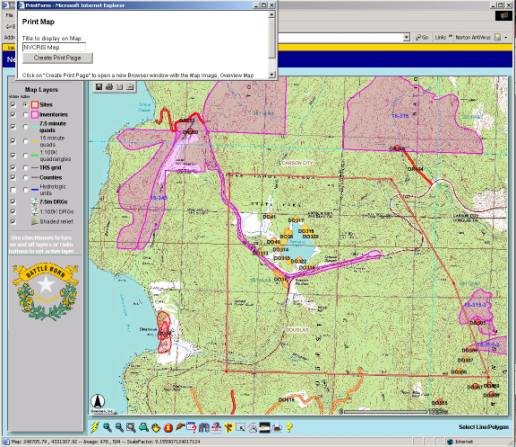
A Print Form appears.
§ Place the cursor in the Title block of the Print Box.
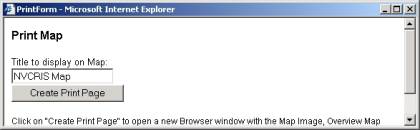
§ Type: My Map
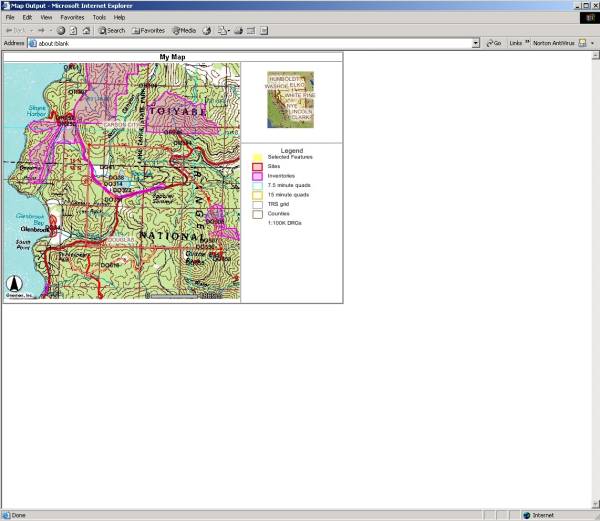
§ Left Click on Create Print Page.
A Map depicting search results is created.
§ From the File Menu, Select Print.
§
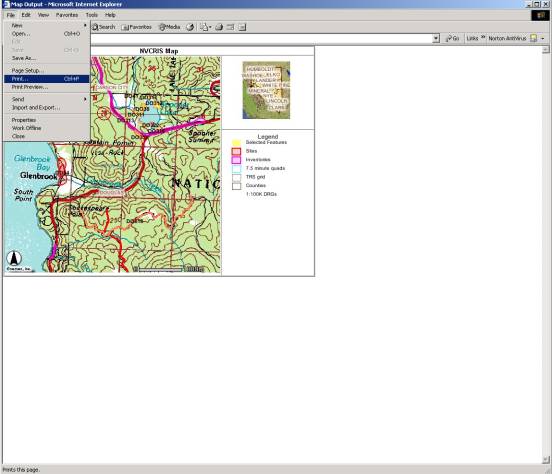
Map will print to selected printer.
§
Clear all selections ![]() and return to the maps full extent
and return to the maps full extent ![]() .
.
|